How does investor sentiment affect financial markets?
This project explores the impact of investor sentiment on financial markets, focusing on the S&P 500. By analyzing sentiment indices and market returns, it aims to better understand the psychological factors driving market behavior. The S&P 500 was selected for its robustness and representation of major companies, though its stability posed a challenge in capturing variability linked to sentiment. Data accessibility was another key challenge, as many APIs and datasets required paid access, limiting available resources. Despite these constraints, the project mainly leveraged machine learning and advanced analytics to examine relationships between sentiment and market performance.
Sentiment Index Chart
This chart compares S&P 500 returns with a sentiment index, exploring their potential relationship over time. The data for S&P 500 returns was scraped from Wikipedia using Python in a Colab notebook and combined with sentiment data from another source. Cleaning and integrating these datasets was challenging but provided a foundation for analyzing correlations and relationships between sentiment and market performance. The visualization reveals that sentiment generally has a lagged effect on most return metrics, meaning changes in sentiment take time to impact market performance. However, this lag was less pronounced for annualized returns, where sentiment and returns appear more closely aligned. These findings suggest that while sentiment influences market trends, its effects are complex and depend on the timeframe and metric analyzed. This initial analysis highlights the potential of sentiment data in understanding market behavior, while also emphasizing the need for advanced techniques to uncover deeper insights.
References:
American Assiociation of Individual Investors (AAII) Sentiment over Time
This chart visualizes investor sentiment over time using data from the American Association of Individual Investors (AAII). The dataset, which is community-contributed, offers insights into how investors feel—whether bullish, bearish, or neutral—on a weekly basis. My aim was to explore whether there was a consensus among groups of investors and how these sentiments evolved over time. Cleaning this dataset was a significant challenge, as it was messy and required extensive preprocessing to make it suitable for graphing. Despite these hurdles, I transformed the raw data into a clean, structured format, enabling it to be visualized effectively. The chart highlights key moments in market history, such as the 2008 financial crisis, where bearish sentiment spiked significantly. However, no single sentiment category dominates over the long term, reflecting the diversity of perspectives within the investor community. The visualization includes an interactive slider, allowing users to explore the dataset at both macro (long-term) and micro (short-term) levels, making it adaptable for analyzing specific periods or trends. This time series analysis underscores the importance of tracking collective investor sentiment during different economic conditions. By combining historical trends with interactive exploration, this visualization provides valuable insights into the dynamics of investor psychology across time.
References:
Scatter Correlation & Regression: VIX and Fear and Greed?
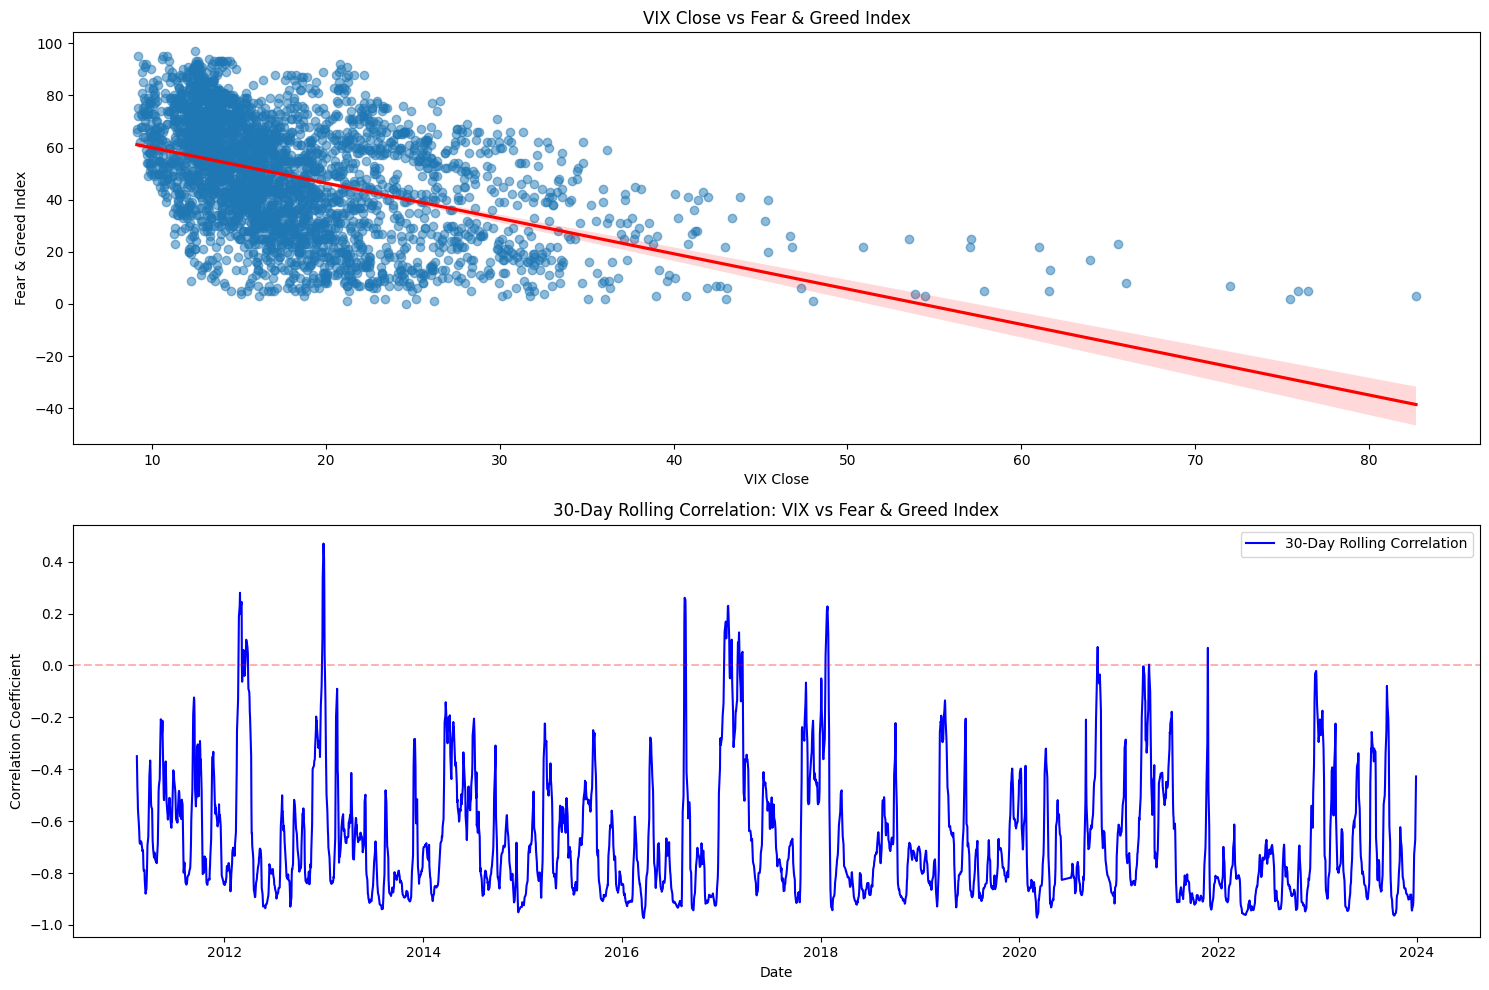
This chart explores the correlation between the CNN Fear & Greed Index and the VIX, a widely recognized measure of market volatility. The Fear & Greed Index was my chosen dataset for exploring sentiment, ranging from 0 (extreme fear) to 100 (extreme greed). The VIX measures market expectations of future volatility. I aimed to explore the relationship between these metrics. Correlating the data in Colab using Matplotlib showed a correlation coefficient of -0.445, meaning that as fear increased, volatility tended to rise. My initial hypothesis was that heightened fear leads to irrational behavior, resulting in greater market volatility. I also implemented a 30-day rolling correlation to examine how the relationship evolved over time, revealing variations in the strength and direction of the correlation during different market conditions. The chart features a scatter plot to illustrate the overall correlation, complemented by a regression line for clarity. Additionally, a time series of the rolling correlation highlights dynamic changes in the relationship, particularly during key economic events.
References:
VIX and Fear & Greed Histograms

VIX Histogram: Frequency distribution of VIX values over time.

While the VIX tends to exhibit extreme values during market turbulence, the Fear & Greed Index displays a more symmetric distribution, capturing the dynamic nature of market sentiment.
References:
Correlation Sentiment and Returns

Correlation and Regression of Sentiment and Annual returns

Heatmap correlation: Different returns and Sentiment
This section explores the relationship between investor sentiment and market returns. The correlation coefficient between sentiment, as measured by the Fear & Greed Index, and market returns was calculated to be 0.34, indicating a weak positive relationship. This suggests that higher sentiment values (indicating greed) are slightly associated with improved market performance, while lower sentiment values (indicating fear) may correspond to weaker returns. To analyze this further, I used Colab to run the regression and calculate the correlation coefficient through a heatmap visualization. The heatmap allowed me to explore the strength of the relationship across multiple return metrics, providing a clearer picture of how sentiment influences market behavior. I utilized the datasets I had previously cleaned and prepared for this analysis, enabling an efficient and streamlined process. These results provide insights into the subtle yet impactful dynamics between market sentiment and financial performance
References:
Clustering Analysis: VIX, Returns, and Fear & Greed

Clustering Descriptions:
- C0 (Bullish): High greed, low volatility, high returns.
- C2 (Bearish): High fear, high volatility, negative returns.
- Neutral: Moderate sentiment, moderate volatility, transitional conditions.
To understand market conditions, I grouped the indexes—Fear & Greed, VIX, and market returns—using a clustering approach. This process was implemented in Colab with the K-Means algorithm, which identifies distinct groups within the data by minimizing intra-cluster variation. Before applying K-Means, I preprocessed the data by cleaning, normalizing, and scaling the variables to ensure accurate clustering results. The analysis revealed meaningful patterns within the clusters. Cluster 0 represented a "bullish market," characterized by high greed, low volatility, and strong positive returns. On the other hand, Cluster 2 was identified as a "bearish market," marked by high fear, high volatility, and negative returns. A neutral cluster reflected transitional conditions with moderate sentiment and volatility. Through the clustering process, I was able to group relationships between sentiment, volatility, and returns under different market conditions. This gave me a perspective on investor behavior, allowing me to transform complex data into a clear understanding of how these factors interact in financial markets.

Random Forest Results:
- Mean Squared Error (MSE): 0.0177
- R-squared (R²): 0.0824
- Feature Importances:
- Fear & Greed: 0.3478
- VIX Close: 0.6522
These results indicate that volatility (VIX) plays a larger role in predicting returns than sentiment (Fear & Greed).
To analyze this relationship further, I implemented a Random Forest regression model. This algorithm constructs multiple decision trees and combines their predictions to enhance accuracy and robustness. Using scikit-learn in Colab, I processed the data, trained the model, and evaluated its performance. The results indicated that other factors also influence the relationship between sentiment, volatility, and market returns, as reflected by the model's performance metrics. Further analysis of feature importance revealed that the VIX (volatility) was the most significant variable in predicting returns, with a contribution of 0.6522 compared to sentiment as measured by the Fear & Greed Index (0.3478). This finding highlights the dominant role of market volatility in influencing financial outcomes, though sentiment remains a contributing factor. Through this process, I was able to gain deeper insights into the dynamics of these variables, providing a foundation for understanding how external factors shape market behavior.
References:
Stock Sentiment Viewer
Analyse market sentiment through news coverage. I used an Alpha Vantage API hosted on an AWS server to pull request real time sentiment. Disclaimer: This is not financial advice.It was a massive learning curve for me to use a server and an API, as well as to clean the data into an actionable graph. The process was challenging but extremely rewarding, as it provided valuable insights into how to transform raw data into meaningful visualizations. This tool displays the overall sentiment from news coverage for a specific stock, offering a quick overview of market perception. I hope to further develop this into a more robust and versatile tool after this course, incorporating additional data sources and advanced features to improve its usability and accuracy. This project has been a stepping stone in understanding real-time data analysis and its potential applications in financial markets.